
��������Ӣ�Z��table����
����Directions:
����The table chart below shows comparison of the earnings of a European company in 2009-2010.
����Using the information from the table chart, write a short essay describing the general changes of the company for the period 2009-2010.
����Write about 150 words on your answer sheet.
|
Time Year |
1Qrt. |
2Qrt. |
3Qrt. |
4Qrt. |
|
2009 |
35(million dollars) |
40 |
36 |
35 |
|
2010 |
40 |
45 |
50 |
60 |
�������ģ�
����The table above demonstrates clearly that some changes have taken place in terms of the earnings of a European company in
����2009 and 2010. We can see that it has a steady rise in 1Qrt and 2Qrt from 2009 to 2010, but it has a significant rise in 3Qrt and 4Qrt from 2009 to 2010.
����It is of no difficulty for us to come up with some possible factors to account for this trend. At the top of list, with the rapid development of our economy and society, the earnings of a European company have been on a rise. In addition, we must admit that the European governments try to support native companies. What is more, a large number of tourists travel to the European countries so that the earnings of European companies are on a significant rise.
����Taking into account what has been argued, we can come to conclusion that this established trend is positive and therefore acceptable. And I firmly certain that this trend will continue in the years to come.
����11��Ӣ�Z������(����)
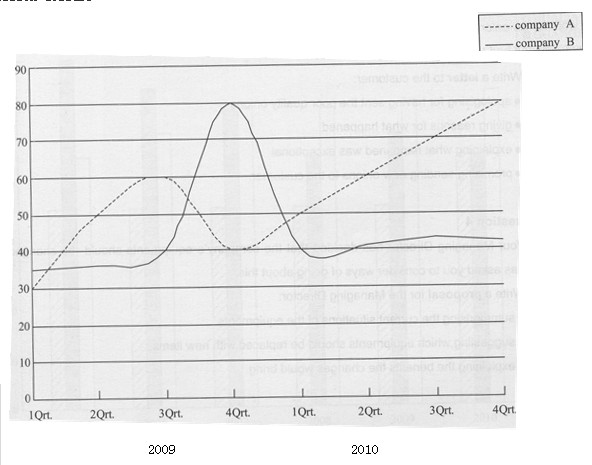
����The graph below shows the sales performance of a product in two European companies between 2009 and 2010.
����Using the information from the graph, write a short essay describing the general movements in these years.
����Write about 150 words
����The Sales Performance of the Products
����million dollars
�������ģ�
����Here is a line chart, clear and accurate. This line chart records the sales performance of a product in two European companies between 2009 and 2010. As is clearly recorded by the graph, both of the two companies have witnessed obvious changes in their sale performances , especially the sales performance of company B has experienced a dramatic change, jumping from 40 million dollars to 80 million dollars during the third quarter of 2009 while dropping back to 40 million dollars in the next quarter. In comparison, the fluctuation of company A is relatively slighter.
����It is not hard to find some possible factors accounting for this phenomenon.On the top of the list is that competition is always so much in the business field. That is why the sales performance of both companies have ups and downs in this graph, and no one can win forever. On another level, the quality or the ways of marketing are changing in these two. Since we see that in the middle of the chart, when company B is rocketing to the top value while the counterpart falls to the bottom.
����In conclusion, as the game goes on, the two companies will find more powerful ideas to promote their products, and this established trend will continue for a longer span in the years to come.
�e�����ٷ����W(w��ng)ע�������Դ��"ԭ��(chu��ng)"�ģ��D(zhu��n)�d���ע��"�����Դ����·�W(w��ng)"���`�ߌ�������؟(z��)�Σ�
�ڲ��ָ����Դ�ھW(w��ng)�j(lu��)�������֙�(qu��n)��Ո(q��ng)(li��n)ϵ�҂���ͨ��Q��
25���X������
13
2013.12
��������Ӣ�Z�����ĽY(ji��)β��ģ�塡��1.The most effective means to solve this problem is that_______......
12
2013.12
��������Ӣ�Z���������g��ģ�����g�Ρ���1.The most obvious reason for this phenomenon is that____......
02
2013.12
�����鿴��2014�꿼��Ӣ�Z�������A(y��)�y(c��)�������R�� ����������С���鿼��������������2014�꿼��Ӣ�Z����......


 ��������(w��)ƽ�_(t��i)ʼ��(chu��ng)��1999��
 ���_�Œ�һ�ߣ��P(gu��n)ע��·�����ٷ���
![�c(di��n)���P(gu��n)�]](http://img.yuloo.com/images/style/weixin_close.jpg)
1999-2025 ������·��(li��n)�Ƽ�����˾���(qu��n)���� | ��ICP��10025267̖(h��o)-13 | �����W(w��ng)���� 11010802025989̖(h��o)
�P(gu��n)���҂� | �̄�(w��)���� | (li��n)ϵ�҂�
��ԃ�Ԓ��010-51268840 ���棺010-51418040
������·��(li��n)�Ƽ�����˾���(qu��n)����